WINTER 2007-8
part 5: Significant windstorm, March 10th 2008? Added March 6th, in
advance; updated March 8 th & 9th.
BACK TO WEATHER-BLOG MENU
New!
Fine Art Prints & digital images for sale-
Welsh Weather & Dyfi Valley landscapes Slide-Library - Click HERE
February
2008 was a quiet affair with very little photography done compared to
the previous two months: however, March is turning out to be rather an
active period. Unusually, I am going to start this entry ahead of the
event, as it were, for on March 10th we look to see one of the worst
windstorms of recent years, if current forecast model output proves to
be correct. Usually within 96 hours of a possible event, if the major
forecast models (GFS, METO and ECM) agree something will happen,
then it will: adjustments only affect the exact path of a storm.
Note: for more details of upper-air processes
please see www.geologywales.co.uk/storms/upthere.htm
| The
German website www.wetterzentrale.de is a superb resource for forecast
charts. The page: http://www.wetterzentrale.de/topkarten/fsavneur.html
is the place to start. Here, I'll use GFS charts from this morning's
0600 run to illustrate what is likely to happen. |
|
 |
|
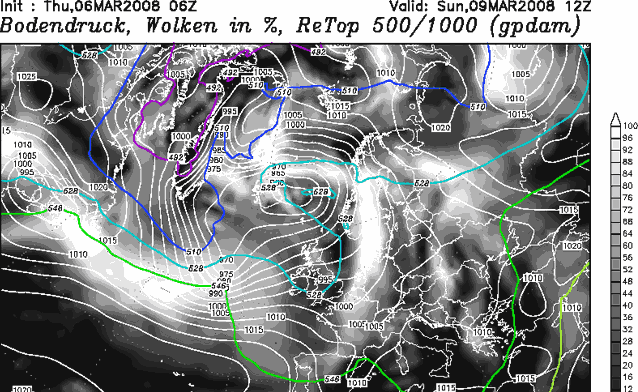
| Here
is the surface pressure chart for Midday Sunday 9th March. Nothing too
out of the ordinary: a depression situated to the north of Scotland and
a low-pressure trough extending SW into the Atlantic, with the Azores
High centred out to the SW. But even here there are clues: the coloured
lines (green, pale blue, dark blue, purple) mark the juxtaposition of
warmer air (green to yellow-green) and colder air (blue down to
purple). We can see that in the mid-Atlantic there are warm and cold
airmasses very close to one another - the green, light and dark blue
lines are no more than about 150 miles apart. Now let's look at what's
going on in the upper air, about 30,000 feet up: |
|
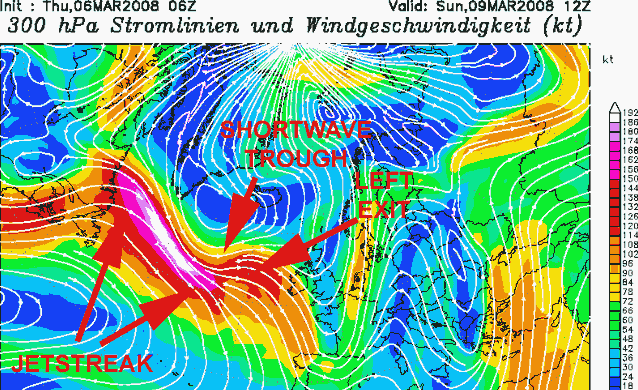 This is a spectacular chart. It shows a very powerful jetstreak running out of Eastern Canada and racing along the Polar Front with phenomenal winds of over 190 knots - that's nearly 220 mph or 100 metres per second! Now, where winds exit a jetstreak on its Polar side - known as the Left Exit region - they fan out. Such divergence is a powerful friend to a developing storm in its own right but here there is the added value too in the shape of a shortwave trough developing in the same area - seen as the kink in the windflow. This is a potentially dangerous set of coincidences - the warm air-cold air justaposition near surface and a shortwave developing in the left exit region of an incredibly powerful jetstreak aloft. Time to look at the next surface pressure chart, for 6 hours later: |
|
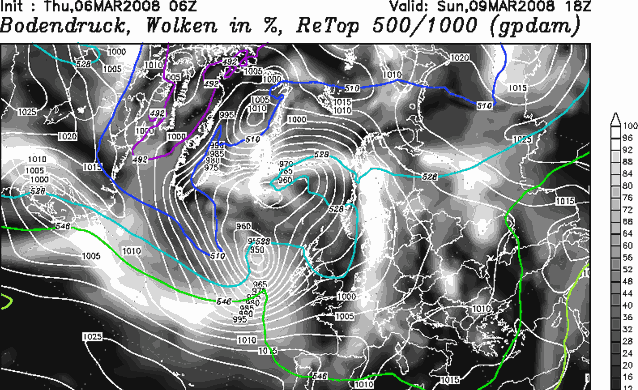 Just compare this surface pressure chart to the one above and you can immediately see that something has occurred. A low pressure system with a centre of 950 mb is sat out there: in just 6 hours the pressure in this area has dropped by 20 millibars. This is known as explosive cyclogenesis (as opposed to rapid cyclogenesis). |
|
 |
|
Tagging
along nicely up there we still have the powerful jetstreak but the
shortwave is becoming more pronounced if anything. The scene is set
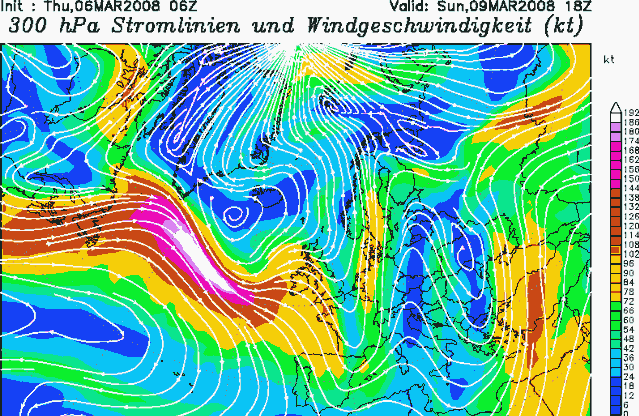
for further deepening into Monday: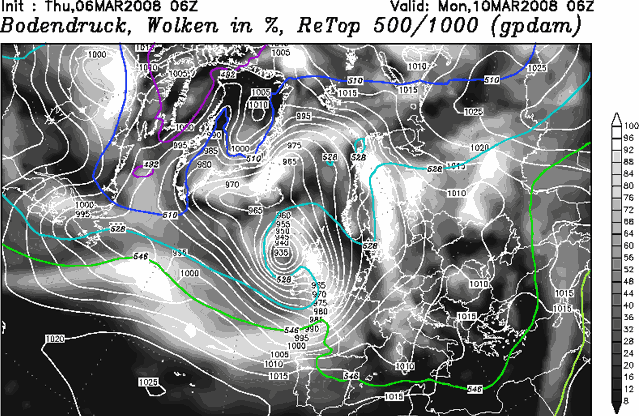 The storm, with a centre down to an amazing 935 mb, is now roaring along off the N Ireland coast (note other runs of the GFS model output have placed it further south and some more fluctuation of this type may be expected as time goes by). The whole UK is being battered by storm-force winds, strong enough to blow down trees and damage proprties, and a danger to anyone caught out in the open. This low pressure system has thus seen a pressure-drop from 970 to 935 mb in just 18 hours - something that more than qualifies the storm to be classified as a "Bomb" - a storm in which the pressure-drop is more than 24 mb in 24 hours. In such storms, winds may exceed hurricane-force (force 12, 72 mph) over a wide area. 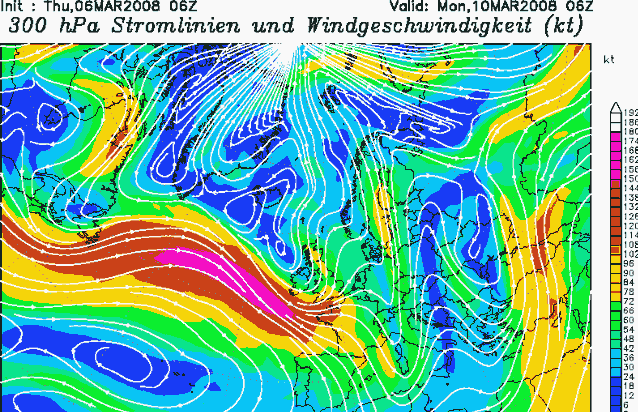 The upper air chart shows that by now the jetstreak has lost some of its strength, the shortwave is crossing the UK and the storm, starting to lose its upper air support, will begin to fill, as the final surface pressure chart, for 18 hours later, shows: 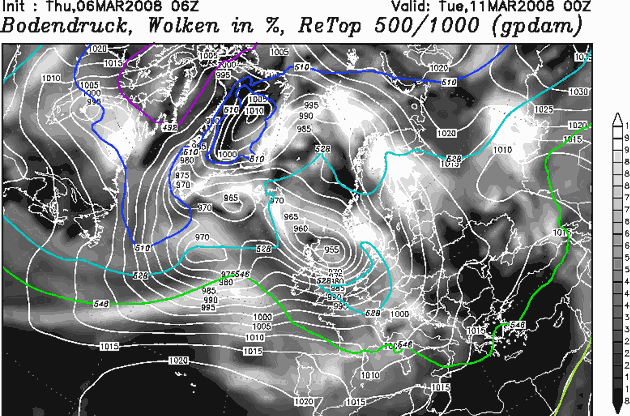 Back up to 955 millibars and rising, then - but it's already given the UK an 18-hour severe mauling. It will be interesting to compare these forecast charts with the actual ones on this coming Monday. If these are correct it is unlikely that I will be "chasing" this storm - for obvious safety reasons. But I'll update this page afterwards. UPDATE: SATURDAY 8th MARCH 2008 The charts below show Thursday's and Saturday's 0600 GFS output.  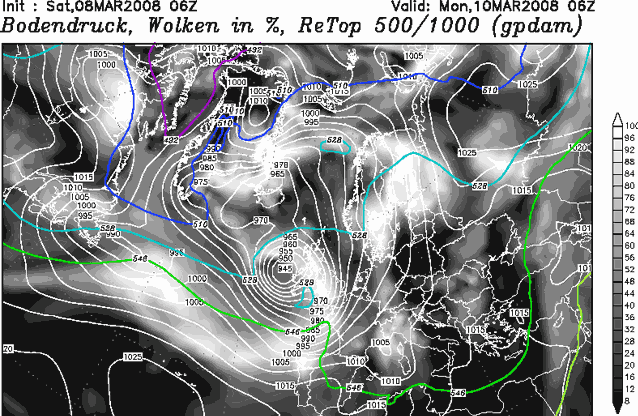 The position of the low remains fairly consistent, suggesting that the GFS did a good job with respect to that factor, given that Thursday was 96 hours out from the event! Central pressure in the low is now forecast to be sub-945 mb as opposed to sub-935 mb, meaning a slightly weaker (but still pokey) pressure-gradient. 945 mb is a very significant figure for the time of year. Two bouts of severe winds are expected: firstly overnight into Monday mornimg, associated with squall-line development along the cold front and secondly later on Monday when the tight gradient seen to the west of Ireland in the above chart crosses the UK. Southern areas of England and Wales (i.e. on the S flank of the low) are to bear the brunt with gusts over 80mph along coasts, and possibly at exposed locations even well inland. Now, with less than 48 hours to go, it'll soon be time to see how accurate this latest forecast is. UPDATE: SUNDAY 9th MARCH 2008 The charts below show Thursday's, Saturday's and Sunday's 0600 GFS output.   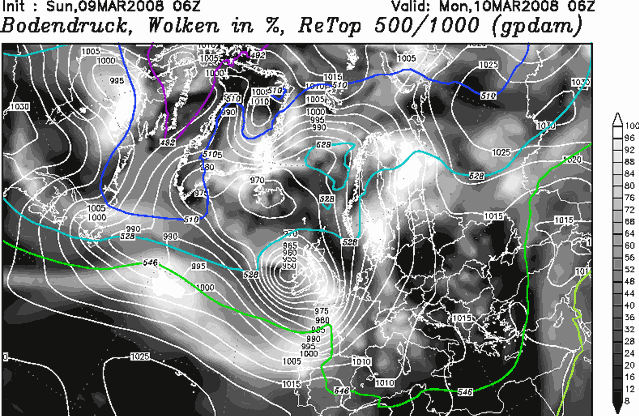 The position of the low has been nudged southwards a little and the central pressure has been reduced by 5 mb - although it is still dropped to 945 mb earlier. It is starting to fill a little earlier: in yesterday's 06 run it maintained its sub-945 mb central pressure through to 0600 on Monday. What might bring about this subtle change? Let's go back to the upper air charts for 0600 on Monday 10th March, again from Thursday's and Sunday's 06 runs:  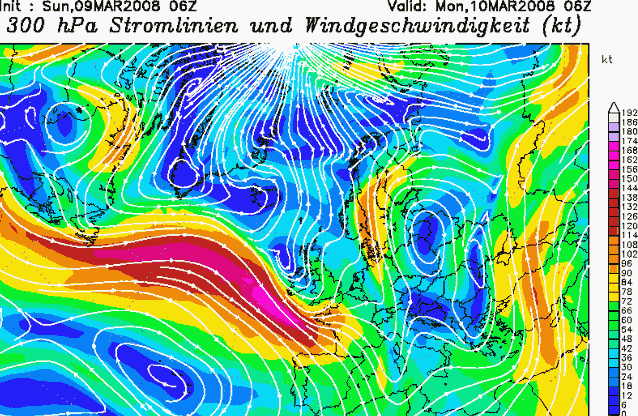 Subtle differences exist here again: the jetstreak's area of maximum winds ("jet-max") has reduced in size a little and the jet core is a little to the south in the more recent run - note that on Thursday's run it is over Cornwall-Brittany-North Biscay whilst on Sunday's it is entirely over Brittany-Biscay. The shortwave trough is pretty much in the same place but is a little sharper with the position of the low centre - just off the NW coast of Ireland - on its upstream (ascending) side. The fact that the trough is sharper - i.e. with a steeper pressure gradient on its upstream side than in previous runs - would suggest a quicker withdrawal of upper support for the low - this would probably be adequate to explain the slightly quicker filling process than seen in previous runs. A 950 mb low pressure system crossing the UK is still something to be reckoned with, however. Whilst this storm is filling as it crosses the UK, some will remember one in which the timing was a little different: the Burns' Day Storm of January 25-26, 1990. Here are the relevant archival charts: 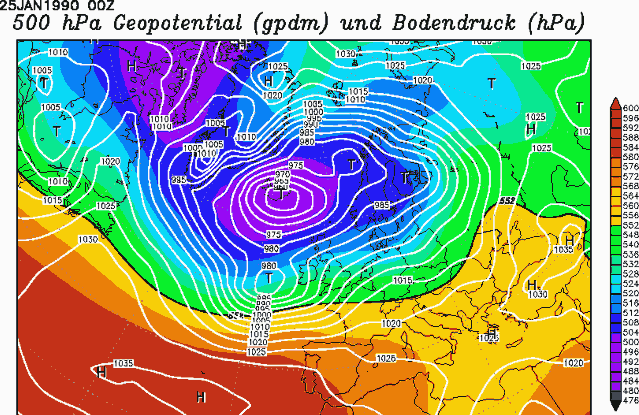 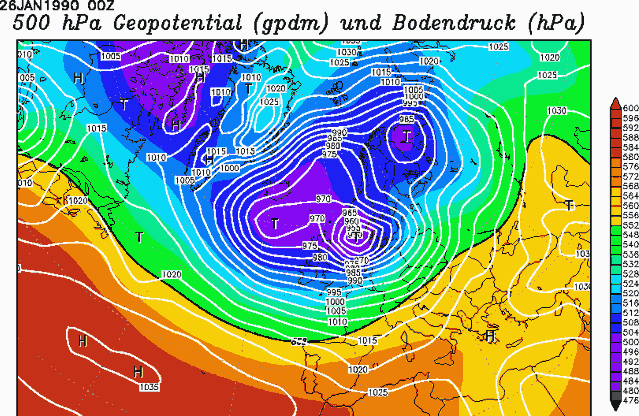 These show a low, 980 mb, west of Ireland at midnight on the 25th, that deepens explosively to be into the North Sea, sub 950 mb, by midnight on the 26th, with a very strong associated windfield. This storm left a trail of death and destruction across the UK and parts of Northern Europe, and the very fact that it was under development i.e. deepening and intensifying as it crossed the UK was the key. That's the thing with such storms - the timing is critical to the outcome. The difference between the Burns' Day Storm and that of Monday 10th March 2008 will be exactly that - timing of development. The Burns' Day was intensifying, whilst this one will be weakening as it crosses the UK and Ireland - and more so than earlier data runs suggested. However, one should not underestimate its ability to produce damaging gusts in areas south of its centre. South and West Wales, SW England and southern coastal counties still look prone to gusts in excess of 80mph, whilst for other areas some very windy conditions with possibly damaging gusts may occur. The area under the low's centre will see an interlude of relative calm as the centre tracks through during Monday daytime. Part 2: So what actually happened? Click HERE! |
|
BACK TO WEATHER-BLOG MENU New! Fine Art Prints & digital images for sale- Welsh Weather & Dyfi Valley landscapes Slide-Library - Click HERE |