why is it so cold?
BACK
TO WEATHER-BLOG MENU
New!
Fine Art Prints & digital images for sale-
Welsh Weather
& Dyfi Valley landscapes Slide-Library - Click HERE
| The
late November cold spell persisted through into December, took a quick
break and then came back mid-month with a vengeance in terms of a
24-hour plus snowfall that gave the valley its worst snow since the
Great Blizzard of January 1982. Most winters, of course, this diary has
featured scenes of feet-deep drifts, but they are above the 300m
contour among the hills that surround the town. Deep snow in
Machynlleth itself is relatively uncommon. I'll do this post in two
parts - firstly a description of events and secondly a look at the
climatological context in the light of some interesting new research
that has been published during the past three years, which raises the
possibility that we may see a greater frequency of such conditions. Part 1: The Severe Snowfall of 17th-18th December 2010 Early December will be remembered by a number of local residents, though, for one thing: ice. On the night of Friday December 3rd, fronts pushed in over Wales, bringing slightly milder air and outbreaks of snow - but rain and sleet mostly at valley level. It fell onto hard-frozen ground and this was the result. This is all ice - covering all surfaces and lethal to drivers and pedestrians alike, including yours truly who spent the 4th limping around with a badly-bashed knee! 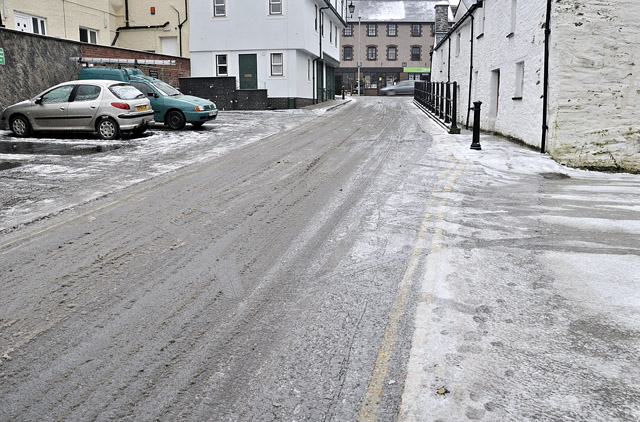 Freezing rain is one of the most dangerous things the weather can dish up - it doesn't need to be excessive as rain, snow or winds do. Any freezing rain will do the job. Fortunately the weather cheered up a bit and my knee stopped hurting so with the forecast looking pretty dodgy for later the next week a firewood-gathering sortie was done. With this lot cut, split and stacked I was ready for everything! 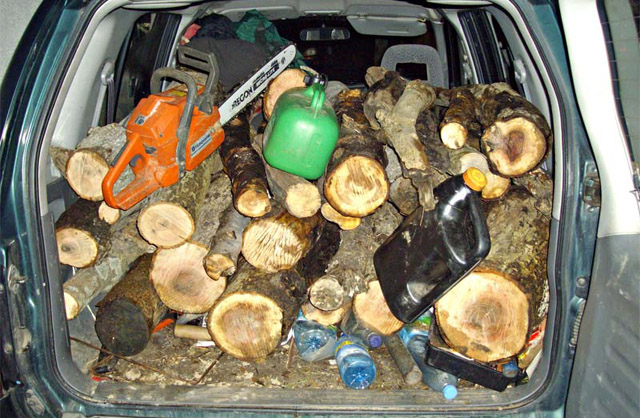 Everything indeed began in the early hours of December 17th, following the clearance of a surging Arctic front the previous day. The winds following the front were northerly: however, a strong low-pressure system that had developed off the east coast of Greenland tracked south in the airflow - an unusual synoptic situation. As it approached the UK, the winds over Wales backed northwesterly. This was important: in such setups the prime driver of snowfall is convective showers that form over the warm seas adjacent to our coasts - the warm sea-cold air coupling creating the instability. Where the showers end up over land is down to the wind direction: in a Northerly they affect the northern coastal counties of Wales and also Pembrokeshire. The more west in the wind, the more extensive the area affected. By 0900 on the 17th, several centimetres of snow had fallen. I wandered down to Dyfi Bridge to be met with a heavy shower of graupel: 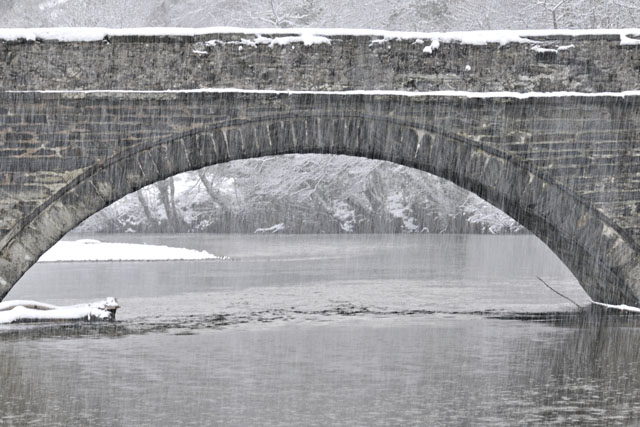 Graupel, sometimes called soft hail, forms when snowflakes within a cloud encounter tiny droplets of supercooled water. Its most important property however is that if a heavy fall occurs and gets incorporated into the snow-profile, its loose and rounded nature means that it does not bond properly like ordinary snowflakes: what results is an unstable layer within the snow, which can act as a focus for major slab avalanches. Climbers and skiers who dig test-pits to check snow-slope safety look for layers of this stuff, among other things. 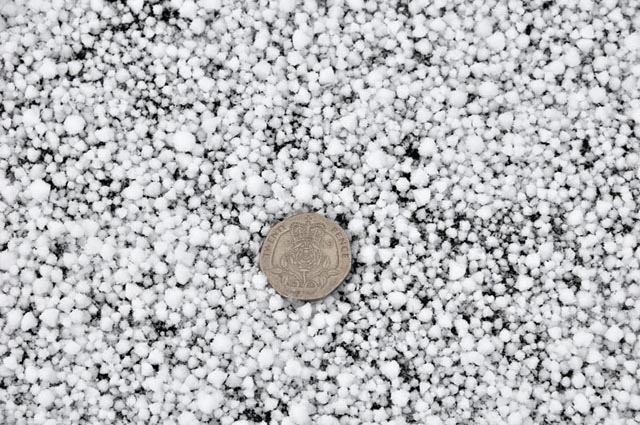 In the nearby forestry, it was still and silent, with the snow stuck to everything.... 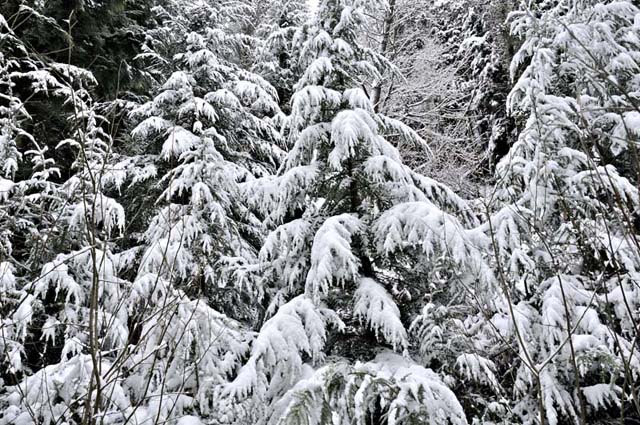 ...until, out of the stillness there came a sudden gust of wind. I just had time to compose and shoot as these tall trees shed their load of snow, filling the air with powder: 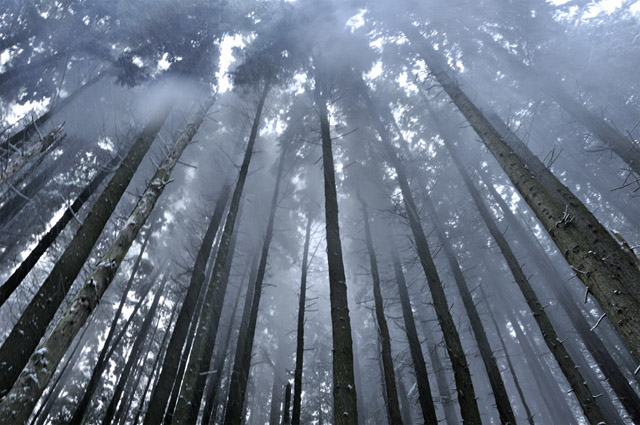 A streamer of snow-showers formed up that afternoon and as a consequence there was intermittent snowfall for the rest of the day and overnight, with the wind backing westerly as the low moved into North Wales. Early on the morning of the 18th, this was the view in Machynlleth: 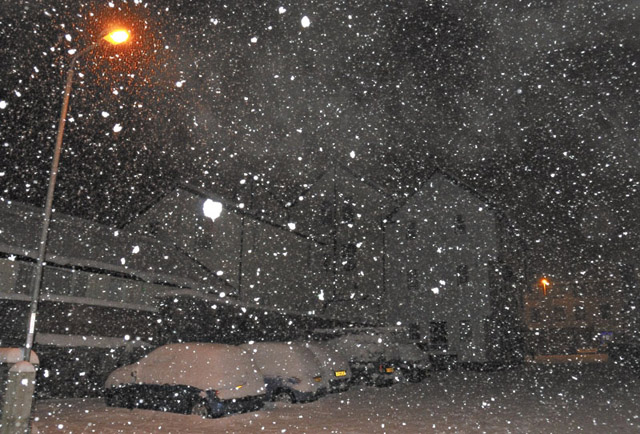 By the time the snow had died out that morning, the depth outside was an exceptional 25cm - this had not drifted at all so it represents an actual total: 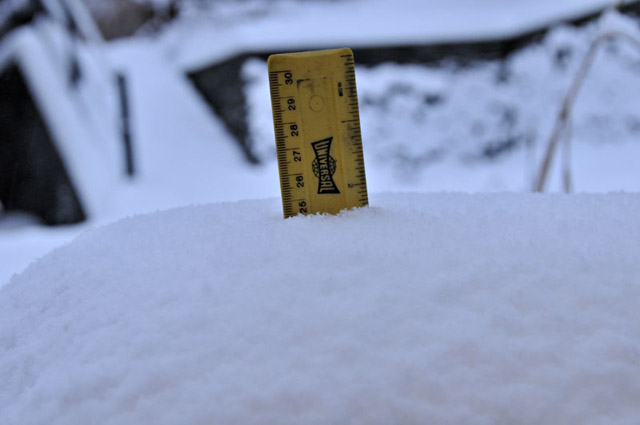 Reports from nearby areas inland and uphill indicated 30-45cm had fallen in places and just out of town there was 30cm too: by their very nature, snow showers lead to a mixture of depths over quite short distances. Rumblings around town announced small avalanches as gravity overcame the tensile strength of the snow on roofs: 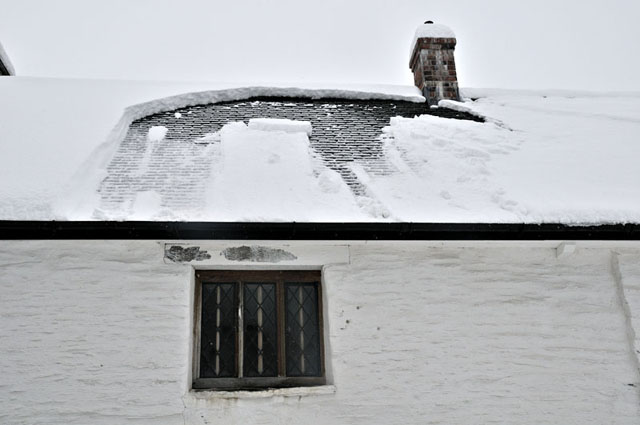 I climbed up onto Penyrallt to get an overall view of the scene: 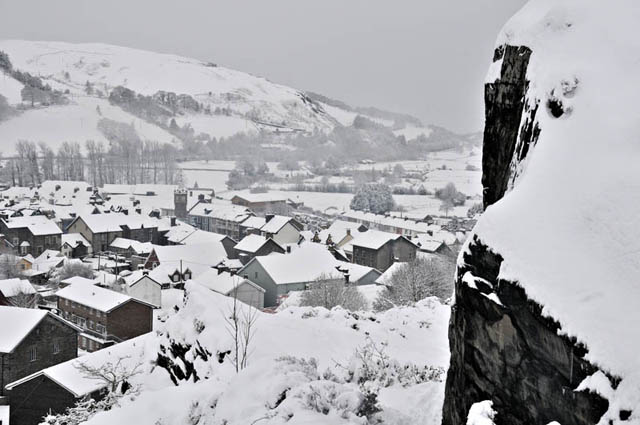 The town was virtually silent apart from the occasional 4x4. Down at the railway station, a train service was kept going although that took a bit of extra work: I guess these guys are dealing with snow and ice-affected points... 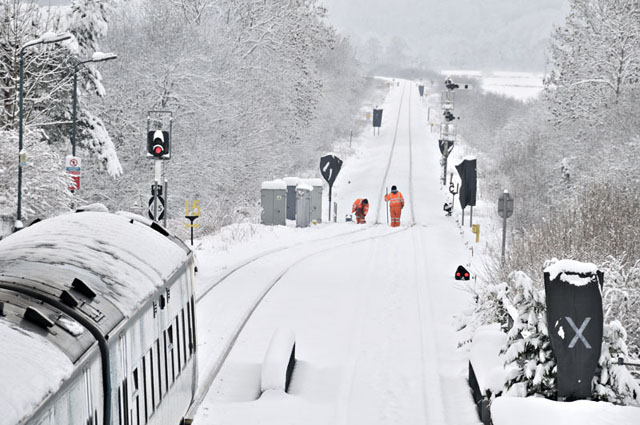 A snowplough came through and a bit of traffic started to turn up, slipping and sliding its way along. I stayed on foot: it seemed a better option given the conditions: 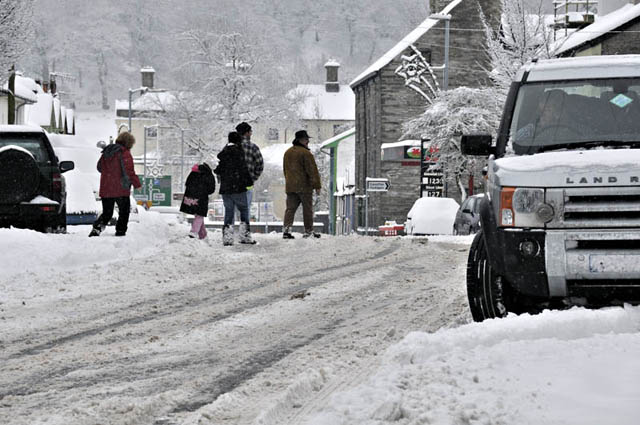 By the afternoon of the 19th, Machynlleth had been mostly dug-out, with high mounds of the stuff dotted about anywhere it could be tipped.... 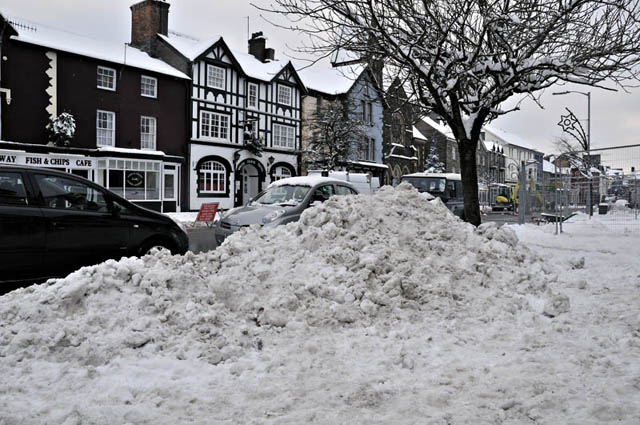 A new hazard had in the meantime emerged: heat escaping through the tops of buildings was causing partial snowmelt but with air temperatures around freezing this promptly refroze into huge icicles hanging tens of feet above the pavement. These WILL break off at some point - beware - and always look up! 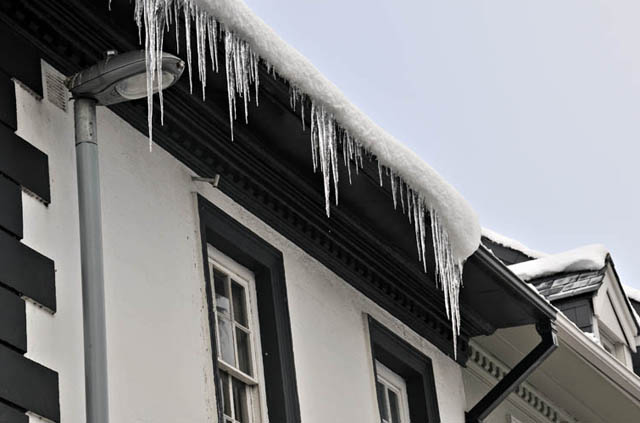 Part 2: The November-December 2010 freeze in context A severe wintry weather outbreak on the scale of this one is guaranteed to generate "So This Is Global Warming"-type headlines in certain sections of the UK media. It's not an unfair question either: if you are freezing cold, unable to get to work due to snowfall and your pipes have just gone and burst, the notion of a planet heating up seems a bit distant to put it mildly. In other posts I've said that I don't like the terms "global warming" or "climate change" and prefer "climate destabilisation" as it's more realistic. The literature all points to more warming in some places than others, and some places even cooling, due to changes in circulation patterns. These are things we can certainly do without. Let's take a closer look. Here's an interesting chart from NASA. It shows global temperature anomalies for November 2010, a month in which Wales broke a monthly all-time cold temperature record. Sources and parameters: GHCN_GISS_HR2SST_1200km Temperature anomaly: compared to the 1951-1980 average. Note: Grey areas signify missing data. Note: Ocean data are not used over land nor within 100km of a reporting land station. 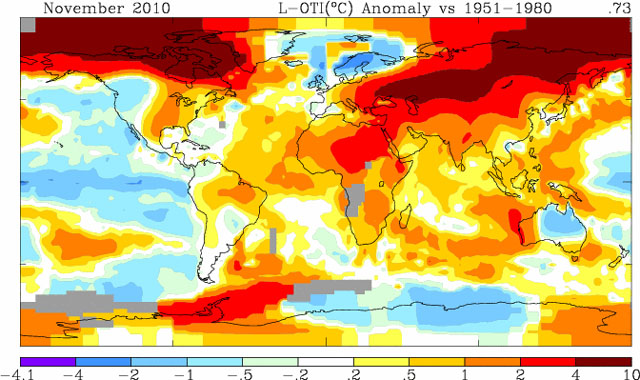 A number of features stand out: for example, the relatively warm Canadian Arctic, the cold anomaly off the west coast of South America - an effect of La Nina - and, relevant to this piece, the very cold UK and Scandinavia. The UK and Ireland generally enjoy a climate that reflects their geographical position: islands situated off the NW tip of a continent, jutting out into a large warm ocean and right in the path of the prevailing south-westerly wind – the direction from which most of our weather tends to arrive. Steering their way between quasi-permanent features such as the Azores High and the Icelandic Low, the south-westerlies bring warmth and rainfall in equal measure, ensuring our crops are watered and the heating bills are kept down. Or they should. This current outbreak of wintriness, with its plummeting temperatures and paralysing snowfalls, has come via an alternative route - pretty much straight over the top of the world. What's going on? Regional-scale fluctuations in weather are often controlled, sometimes in a cyclic fashion, by large-scale climatic patterns: thus we have El Nino and La Nina in the Tropical Pacific, with their sometimes major impacts on rainfall – or lack of it. Here in the North Atlantic, things are usually controlled by the strength of the pressure-gradient between the Azores High and the Icelandic Low and by their positions relative to one another. If the gradient between them is strong – as would be the case with intense high pressure over the Azores and deep low pressure over Iceland, a strong west-to-east airflow results and Atlantic storms trundle along one after another, powered by a strong jetstream, bringing mild, wet and often windy conditions to our shores. This weather-pattern is referred to as highly zonal, or mobile. It is the North Atlantic Oscillation (NAO) in its positive phase - the chart below shows a typical example - the red arrows show the mild winds sweeping in from the warm ocean: 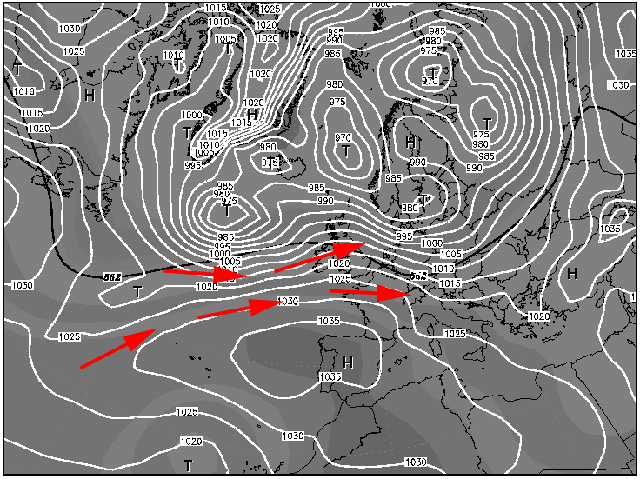 The weaker the pressure-gradient between the Azores High and the Icelandic Low, the more negative the NAO becomes. This results in strongly reduced zonality, to the point that instead a meridional pattern develops – where the jetstream is relatively weak and our weather comes from either the north or the south, bringing (depending on the time of year and direction of airflow) heatwaves or big freezes - as shown in the recent chart below - warm winds are red, cold ones blue: 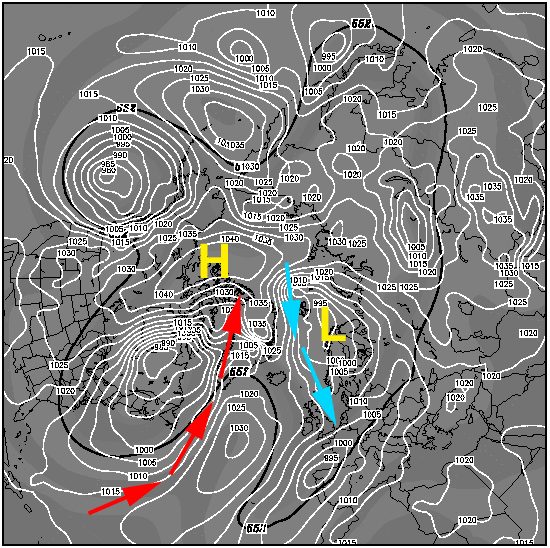 Now, to complicate matters further, a new atmospheric circulation pattern has been identified: the Arctic Dipole, which has become an increasingly-important feature of the Arctic climate during the first decade of the 21st Century. Arctic weather has until recently been driven by the NAO and its close relative, the Arctic Oscillation (AO), both of which broadly produce a circumpolar airflow from west to east. Now, with the Dipole, they have competition and it is having some strange affects on the climate of the Arctic and further afield. The Arctic Dipole pattern features anomalously high and low pressure systems – they are occurring and persisting where previously they did not. When the Dipole is dominating things, high pressure builds over the American side of the Arctic and low pressure forms on its Eurasian side: this results in an extremely meridional pattern in which winds blow south-to-north through the Bering Strait and into the Arctic from the Pacific, importing extra heat in the process and driving Arctic temperatures further upwards, encouraging further melting of sea-ice well beyond that expected due to anthropogenic greenhouse gas emissions alone. But – ironically – several studies published over the past few years have concluded that the mechanism for its formation was triggered by low sea-ice extent in the first place: it is an example of a positive climate feedback pattern. It works thus: sea-ice has a high albedo – that is, it reflects a lot of solar energy back out to space. Over areas where that ice has melted, the energy is instead absorbed by the open sea-water, warming it. The open water reaches its maximum extent in mid-September: during the Autumn, the research has found, it returns some of that heat back to the lower atmosphere, driving up air temperatures and thereby affecting pressure and atmospheric circulation patterns, which in return go on to cause further excessive summer ice-loss in subsequent years. But these changes are not just affecting the Arctic. In their updated Arctic Report Card for 2010 (reference 1 at end of page), Overland et al note: “Winter 2009-2010 showed a major new connectivity between Arctic climate and mid-latitude severe weather, compared to the past.” They show what would be considered to be a “normal” pressure-pattern, with anticlockwise circumpolar winds, and then explain how December 2009 saw a complete reversal of this pattern, that essentially eliminated the normal west-to-east jet stream winds. This allowed cold Arctic air to penetrate deeply into some southern regions such as Europe, resulting in very low temperatures and snowy conditions: Northern Eurasia (north of 50° latitude to the Arctic coast) and North America (south of 55° latitude) had negative monthly temperature anomalies of -2°C to -10°C – whilst at the same time, Arctic regions had positive anomalies of +4°C to +12°C. This change in atmospheric circulation has been given the working name of the Warm Arctic-Cold Continents climate pattern. This year a similar pattern appears to have emerged: on November 28th, temperatures in parts of Wales fell to -18C (a November record minimum), but at Kangerlussuaq, inside the Arctic Circle in western Greenland, the minimum was +9C, an amazing 27C warmer. The graph below shows Arctic sea-ice extent on December 18th 2010. Although ice volume is a better measure, as it demonstrates how much multi-year ice is left (not a lot), extent gives a good idea as to how the seasonal re-freeze is going. It got off to a good start in September 2010, but has since slowed, so that for parts of both November and December it has been the lowest on record. 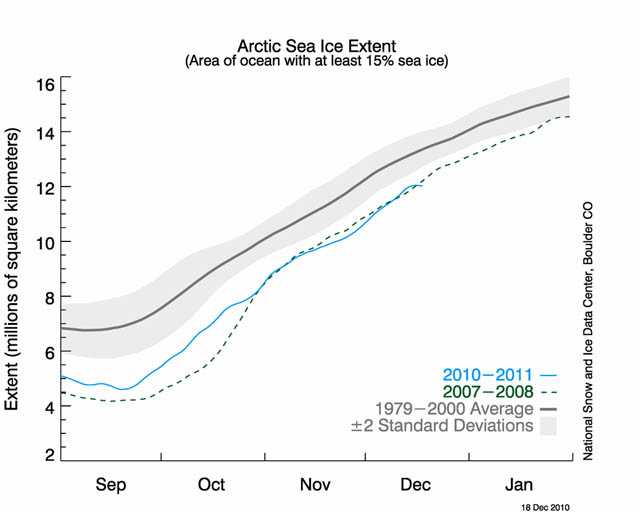 In the case of the Warm Arctic-Cold Continents pattern, one explanation with respect to effects further afield in Europe may be this observed anomalously low late Autumn ice coverage – and accompanying high heat-flow from sea to atmosphere - in the Barents and Kara seas, marginal parts of the Arctic Ocean situated to the north of Scandinavia and Russia (location map below). This potential influence – the “B-K Effect” - has been analysed using a global atmospheric circulation model by Vladimir Petoukhov of the Potsdam Institute for Climate Impact Research and Vladimir Semenov of the Leibniz Institute of Marine Sciences at Kiel University in a study submitted in November 2009 and recently published in the Journal of Geophysical Research (reference 2). Petoukhov and Seminov found that the model responded in a non-linear fashion: rather than resulting in a warming over adjacent continents as might have been expected, a strong regional cooling was generated within a certain range of sea-ice cover. In the abstract, they go so far as to state: “Here we show that anomalous decrease of wintertime sea-ice concentration in the Barents-Kara (B-K) seas could bring about extreme cold events like winter 2005-2006.” The paper, and indeed the whole subject of cold European winters and how they relate to the overall global climate, has been the subject of much lively discussion, in the context of that particular winter and others past and present. Writing on the Realclimate blog on December 14th 2010 (reference 3), Rasmus Benestad of the Norwegian Meteorological Institute noted that, while Petoukhov and Seminov's findings sound plausible, things may not be so straightforward. With respect to using global circulation models to determine regional effects, he commented: “There is a limit to what they are able to describe in terms of local regional details, and it it reasonable to ask whether the response to changes in regional sea-ice cover is beyond the limitation of the global model.” 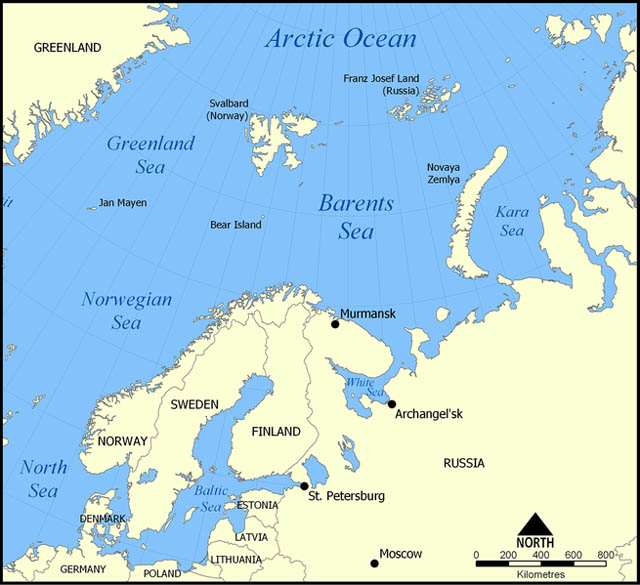 However, talking about non-straightforwardness, it is also apparent that, whilst important, the NAO alone is not an absolute way to determine how a particular cold winter compares to others. NAO data are available online from the National Center for Atmospheric Research at Boulder, Colorado (reference 4). The data show that the cold winter of 2009-10 featured the lowest ever December-February (DJF) NAO index of -5.1. However, whilst 2009-10 caused major problems in parts of the UK, it was not as cold as the historic 1962-63 winter, with a higher NAO index of -4.0 but, in the UK, having a Central England Temperature (CET) of -0.3C for the DJF period. The CET for the equivalent period in 2009-10 was 2.4C. If the NAO was the absolute control-mechanism with respect to the severity of our winters, then by rights 2009-10 should have been colder than 1962-3. So: has recent research found an added influence on our European winters? The Arctic has become an area of substantial positive temperature anomalies: this has been directly observed. The sea-ice anomalies and lower atmosphere heating over open Arctic water in Autumn have been directly observed. The relatively new Arctic pressure and atmospheric circulation patterns have been directly observed. Papers have been published citing evidence for these features to have a potential effect on the climate further afield, including an increased severity of European winters. Although climate trends are multidecadal affairs and the research discussed above is relatively recent, the influence of open sea water in the Arctic, where at one time there was extensive sea-ice, is clearly one to watch in the coming years. As with most matters of science, the truth will come out in the wash in due course. This may not be the black-or-white conclusion that policymakers seem to expect these days, but that's how the world works: they might like to stop and reflect that the decisions that led to the Allies' victory in World War 2 were not made in the light of absolute certainty of outcomes. Acknowledgments: Thanks to James Overland of NOAA for sending me reprints of papers discussing the matters described above, and to the Climate Rapid Response Team at http://www.climaterapidresponse.org/ for their useful help with my research. References & further reading: 1) http://www.arctic.noaa.gov/reportcard/atmosphere.html 2) Petoukhov, V., and V. Semenov (2010): A link between reduced Barents-Kara sea ice and cold winter extremes over northern continents. J. Geophys. Res.-Atmos., ISSN 0148-0227. 3) http://www.realclimate.org/index.php/archives/2010/12/cold-winter-in-a-world-of-warming/ 4) http://www.cgd.ucar.edu/cas/jhurrell/indices.data.html#naostatseas Budikova, D. (2009): Role of Arctic sea ice in global atmospheric circulation: A review. Global Planet. Change, 68(3), 149–163. Honda, M., J. Inoue, and S. Yamane (2009): Influence of low Arctic sea-ice minima on anomalously cold Eurasian winters. Geophys. Res. Lett., 36, L08707, doi:10.1029/2008GL037079. Overland, J.E., and M. Wang (2010): Large-scale atmospheric circulation changes associated with the recent loss of Arctic sea ice. Tellus, 62A, 1–9. |
|
BACK TO WEATHER-BLOG MENU New! Fine Art Prints & digital images for sale- Welsh Weather & Dyfi Valley landscapes Slide-Library - Click HERE |